Size: x-small
Type: color
Referansebane for klimagassutslipp i Oslo fram til 2030
Sammendrag
Om referansebanen
Referansebanen viser et anslag for hvordan klimagassutslippene i Oslo kan utvikle seg fram til 2030 i et tenkt scenario der det ikke gjennomføres nye eller forsterkede klimatiltak etter 1.1.2022, og der man kun tar med de tiltakene i Oslo kommunes klimabudsjett som allerede var vedtatt og ferdig implementert før den datoen.
Referansebanen er ikke en prognose for hva som faktisk kommer til å skje, og gjør en rekke antakelser som ikke nødvendigvis vil slå til. Usikkerheten i beregningene er også betydelig. Tallene i referansebanen bør derfor sees på som en illustrasjon av retning og størrelsesordener snarere enn eksakte forutsigelser.
Referansebanen bygger på en framskriving av de underliggende faktorene som antas å styre utviklingen i utslippene (som befolkningstall, aktivitetsnivå i ulike sektorer, utvikling i bilparken og utslippsintensitet i ulike sektorer, etc.), på opplysninger som var tilgjengelig per januar 2022 om de ulike faktorene, og på en rekke antakelser om framtidig utvikling. Usikkerheten rundt hvordan hver faktor og de samlede utslippene vil utvikle seg, er betydelig. Resultatene gir likevel en pekepinn for hvordan de viktigste utviklingstrekkene ser ut, og strukturen bak beregningene danner et utgangspunkt som kan benyttes til videre analyser og beregning av tiltakseffekter.
Dagens klimagassutslipp i Oslo
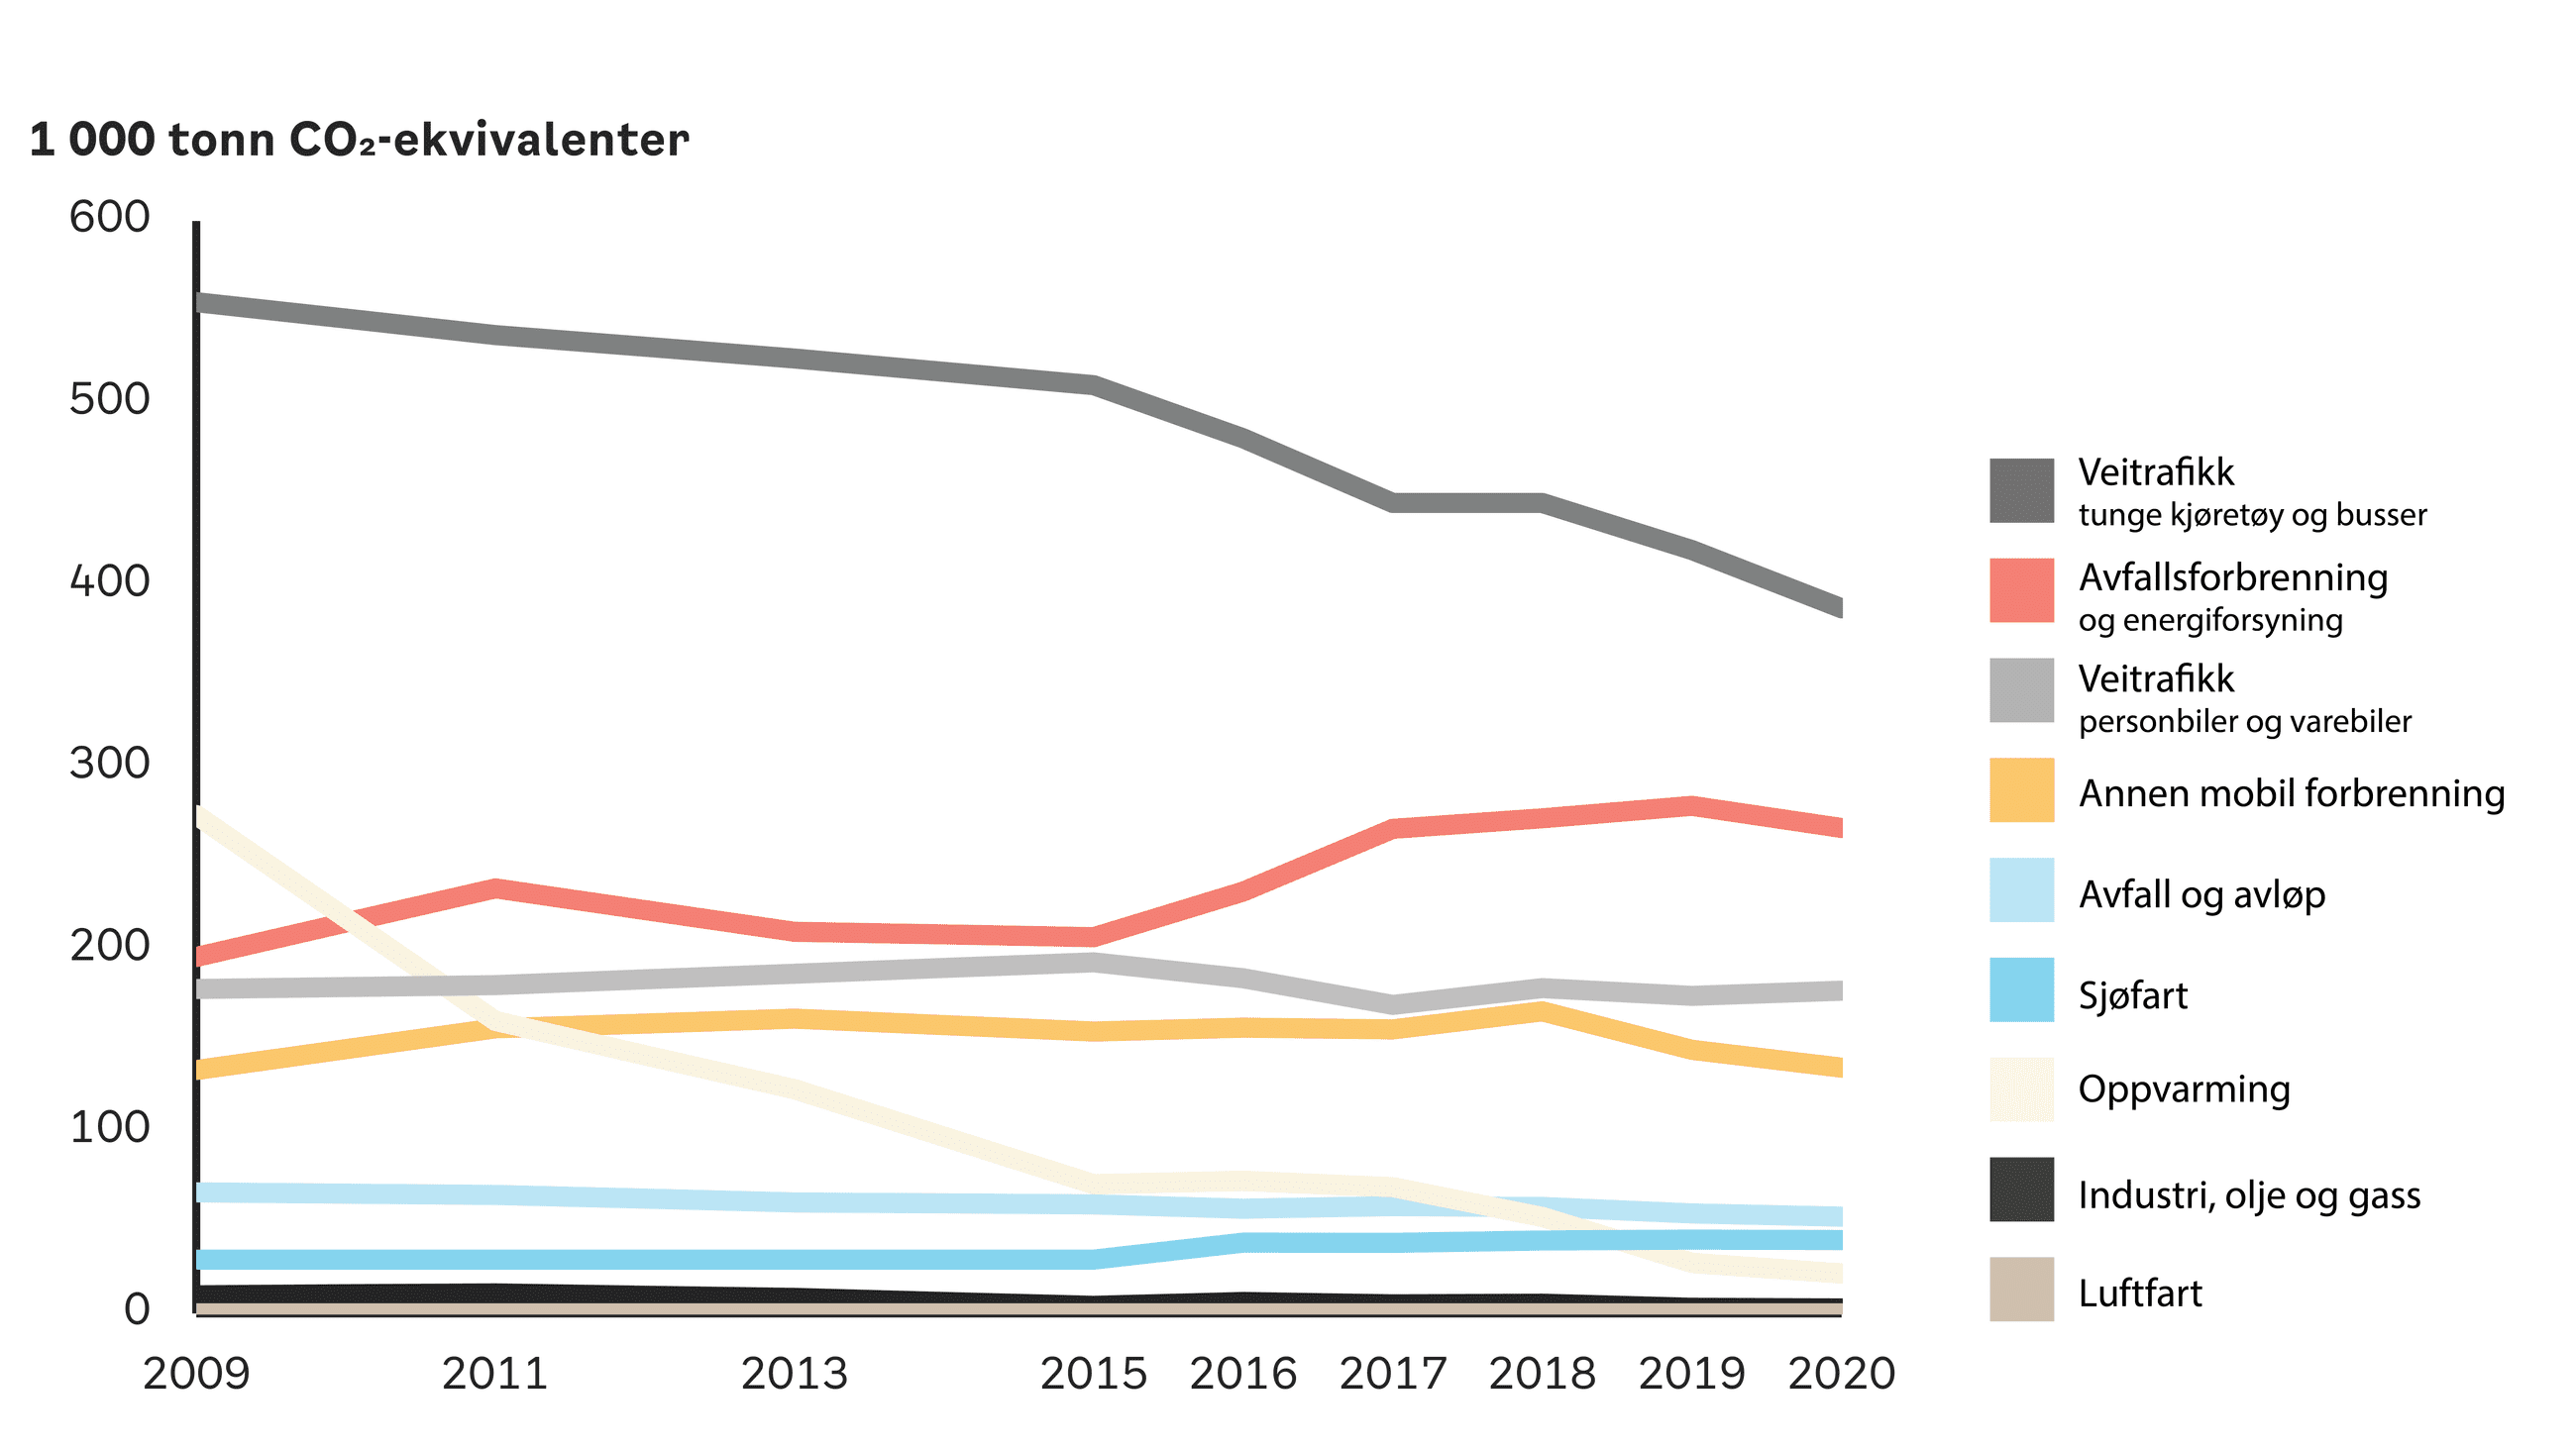
De samlede klimagassutslippene i Oslo var ca. 1,08 millioner tonn CO2-ekvivalenter i 2020, ifølge Miljødirektoratets kommunefordelte klimagassregnskap. Dette er en reduksjon på 25 prosent i forhold til 2009(¹). Det meste av reduksjonen har kommet fra store nedganger i utslippene fra veitrafikk og fra oppvarming, grunnet en blanding av økende andel nullutslippsbiler, innblanding av biodrivstoff, mer effektive kjøretøy, og utfasing av fyringsolje til oppvarming.
Over halvparten (52 prosent) av utslippene i 2020 kom fra Veitrafikk. Andre store sektorer er Energiforsyning (25 prosent, nesten alt fra avfallsforbrenning) og Annen mobil forbrenning (12 prosent, fra ulike typer ikke-veigående maskiner). Disse tre sektorene utgjorde til sammen 89 prosent av utslippene. Hovedbildet har vært det samme i tidligere år, bortsett fra at Oppvarming tidligere også var en stor utslippssektor.
Sektorer og avgrensninger
Beregningene i denne rapporten omfatter de samme sektorene som Miljødirektoratets kommunefordelte klimagassregnskap og de samme klimagassene: karbondioksid (CO2), metan (CH4) og lystgass (N2O). Beregningene benytter den samme inndelingen i
sektorer og utslippskilder som Miljødirektoratet, og er kalibrert til å gi de samme utslippene som i Miljødirektoratets klimagassregnskap for årene til og med 2020.
I likhet med Miljødirektoratets klimagassregnskap for Oslo omfatter beregningene kun utslipp innenfor kommunegrensa. Utslipp i andre kommuner og land som skyldes aktivitet i Oslo kommune tas ikke med. Utslipp i Oslo som skyldes aktivitet utenfor kommunen, som gjennomfartstrafikk og forbrenning av avfall fra andre kommuner, trekkes heller ikke fra. Disse avgrensningene er kun en avgrensning av hva referansebanen dekker, og antyder ikke at tiltak for å redusere utslipp som finner sted utenfor Oslo kommune er mindre viktige.
Når man overveier tiltak for å redusere utslippene i forhold til referansebanen, er det viktig å ta med i vurderingen hva effekten er på utslipp utenfor Oslo, og sørge for at utslippsreduksjoner i Oslo ikke fører til at utslippene bare flyttes ut av kommunen eller i verste fall øker enda mer andre steder.
Utvikling av utslippene i referansebanen
I referansebanen går utslippene ned med 19 prosent fra 2020 til 2030, fra 1,08 millioner til 0,88 millioner tonn CO2-ekvivalenter. I forhold til tallene for 2009 i Miljødirektoratets klimagassregnskap går utslippene ned med 39 prosent i 2030.
Utslippsreduksjonen skyldes nesten i sin helhet fortsatt nedgang i utslipp fra Veitrafikk, som i sin tur kommer nesten utelukkende fra økende andel nullutslippsbiler. Det aller meste av reduksjonen kommer fra personbiler pluss noe fra varebiler, mens utslippene
fra tunge kjøretøy går noe opp. Referansebanen omfatter ikke elektrifisering av busser som er vedtatt, men ikke gjennomført ennå. Den omfatter heller ikke mulige justeringer i omsetningskravet for biodrivstoff eller andre forsterkinger av eksisterende klimatiltak utover det som var vedtatt per 1.1.2022.
I tillegg til Veitrafikk går utslippene prosentvis betydelig ned i sektoren Avfall og avløp, på grunn av at utslipp av avfallsdeponigass gradvis avtar i takt med at nedbrytbart avfall i
gamle deponier brytes ned og minker. Utslippene går også betydelig ned i Sjøfart, på grunn av nedleggelsen av Stena Line sin rute til Frederikshavn i løpet av 2020, og på grunn av at utslippene går tilbake til normalen etter en periode med høye utslipp i havn fra utenriksfergene på grunn av lang liggetid under COVID19-pandemien. I tillegg bidrar tre lokale tiltak i disse sektorene til lavere utslipp: Uttak av metangass fra Grønmo og Rommen avfallsdeponier (som gir reduserte deponigassutslipp), elektrifisering av Nesodden-båtene, og landstrøm til utenriksfergene. Disse tre tiltakene gjør at samlede utslipp i 2030 blir anslagsvis 21 tusen tonn lavere enn de ellers ville vært.
I de fleste andre sektorer er det små eller uvesentlige endringer i utslippene mellom 2020 og 2030.
Usikkerheten i framskrivingene er betydelig. De usikkerhetene som er blitt kvantifisert, gir et usikkerhetsintervall for totale utslipp i 2030 fra 0,65 millioner til 1,10 millioner tonn CO2-ekvivalenter (mot 0,88 millioner tonn CO2-ekvivalenter i middelverdien). I tillegg er det mange kilder til ikke-kvantifiserbar usikkerhet, som uforutsette hendelser, uvisshet om framtidig teknologisk utvikling, markedsutvikling, store atferdsendringer og ukjente kilder til usikkerhet i de underliggende datakildene.
Den ikke-kvantifiserte usikkerheten forsterkes ytterligere av uvisshet om hvordan transportmønstre vil utvikle seg i etterkant av COVID19-pandemien, og samt uvisshet både om hvordan strømprisene vil utvikle seg i årene som kommer, og om hvordan dette vil påvirke energiforbruk og valg av energityper i ulike sektorer.
Klimagassutslippene i 2030 og Oslo kommunes klimamål
I middelverdien for referansebanen blir utslippene i 2030 0,88 millioner tonn CO2-ekvivalenter, en nedgang på 39 prosent i forhold til 2009. Dette er en betydelig nedgang, men fortsatt langt unna Oslo kommunes mål om 95 prosent reduksjon. Referansebanen har ikke med effekten av tiltak i Oslo kommunes klimabudsjett som ikke er gjennomført per 1.1.2022, og heller ikke effekten av eventuelle utredede tiltak som ikke ennå er vedtatt. Men selv med slike tiltak vil det sannsynligvis gjenstå et betydelig gap.
(¹) Merk at Miljødirektoratets kommuneordelte klimagassregnskap ikke har reelle tall for 2009 for enkelte
sektorer. Spesielt Sjøfart, hvor tallene for 2015 benyttes for alle tidligere år.