Size: large
Type: image

As the first municipality in Norway, the City of Oslo prepared a climate budget for 2017. This was groundbreaking work and several municipalities have now followed suit.
In 2016, the City Council had just adopted ambitious plans to cut greenhouse gas emissions in the city. This resulted in the launch of the Climate Budget as a necessary governance tool.
The Climate Budget shows:
- how the targets are to be achieved
- what mitigation measures have been put in place
- who is responsible for completing them
VIDEO: This is how the City of Oslo develops its Climate Budget .
Can you calculate CO2 and make a budget out of the figures?
It sounds simple, but it’s not. The first thing you have to do is calculate how much emissions have to be reduced if we are to achieve our goals. You then have to develop good, efficient mitigation measures to reduce emissions. When doing this, we start out by looking at those sources in the city with the highest emissions. We find this information in the GHG emissions statistics (Norwegian), which show where we have had the greatest challenges historically (since 2009).
Every time a petrol or diesel-powered vehicle drives down the streets in Oslo, greenhouse gases are emitted. It is possible to calculate the volume of greenhouse gas emissions today and how these will change if we eliminate a certain number of vehicles from the roads or if the vehicles make the change to zero-emissions technology.
It is also possible to calculate the impact on greenhouse gas emissions if more citizens in Oslo make the change to cycling, walking or public transport instead of driving a car that runs on fossil fuels.

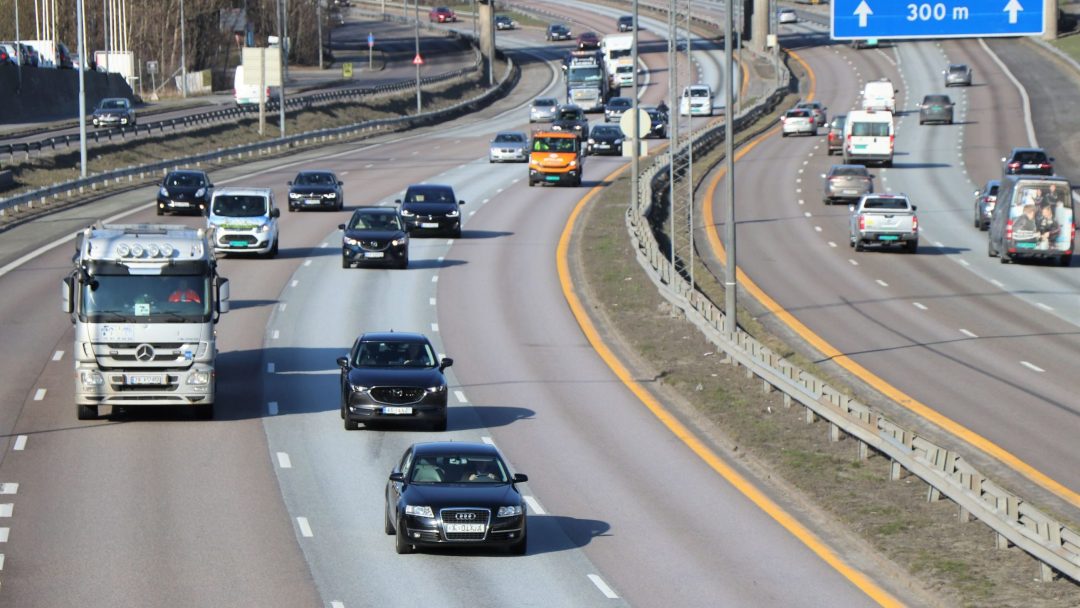
We can make dramatic reductions to greenhouse gas emissions if the number of cars running on fossil fuels is reduced. Photo: Nils Gelting Andresen.
If we are to achieve the climate goals in Oslo, emissions have to be cut dramatically. The budget shows how much we have to reduce emissions by each year. It also shows us how to make these cuts, by specifying figures to quantify the impact of different measures. One example of this is the figures for what happens when more people decide to cycle or drive electric cars instead of diesel-powered cars.
The City of Oslo can take measures to encourage this, for example by building cycling paths or funding charging stations in housing cooperatives.
The advantage of a climate budget is that it shows who is responsible for providing these cuts in emissions.
How do we make use of the Climate Budget?
The Climate Budget is fully integrated in the municipal financial budget and also follows the City of Oslo’s budget cycle The Climate Budget contains measures designed to ensure that the emissions do not exceed the target for the next year. A City Government department or agency is allocated responsibility for completion of each of these measures.
All entities of the City of Oslo are responsible for taking the effects on GHG-emissions into account during daily operations and for proposing new measures to reduce emissions for the annual climate budgets. The City of Oslo’s Climate Agency is responsible for calculating what these measures will provide in terms of emission reductions. This allows for the preparation of a list of mitigation measures and their impact, which can then be used as a governance tool to ensure that emissions are reduced.
In order to monitor the implementation and effects of the measures, to see if they have the desired effect, we ensure regular reporting. A “Climate Barometer” has also been developed, with a number of indicators. This is available to the public and published three times a year and shows whether emissions are heading in the right direction.
- You might also want to read: “It’s great that the electric bus is so quiet to drive”
What are direct and indirect greenhouse gas emissions?
When we talk about GHG emissions, we refer to direct emissions and indirect emissions. Direct emissions are greenhouse gases emitted in Oslo as a result of an action inside the city boundaries, for example driving a petrol-powered car in the city. Indirect emissions take place outside of Oslo, but as a consequence of our actions. If the car we are driving was produced in Germany, the factory there will have emitted greenhouse gases during production.

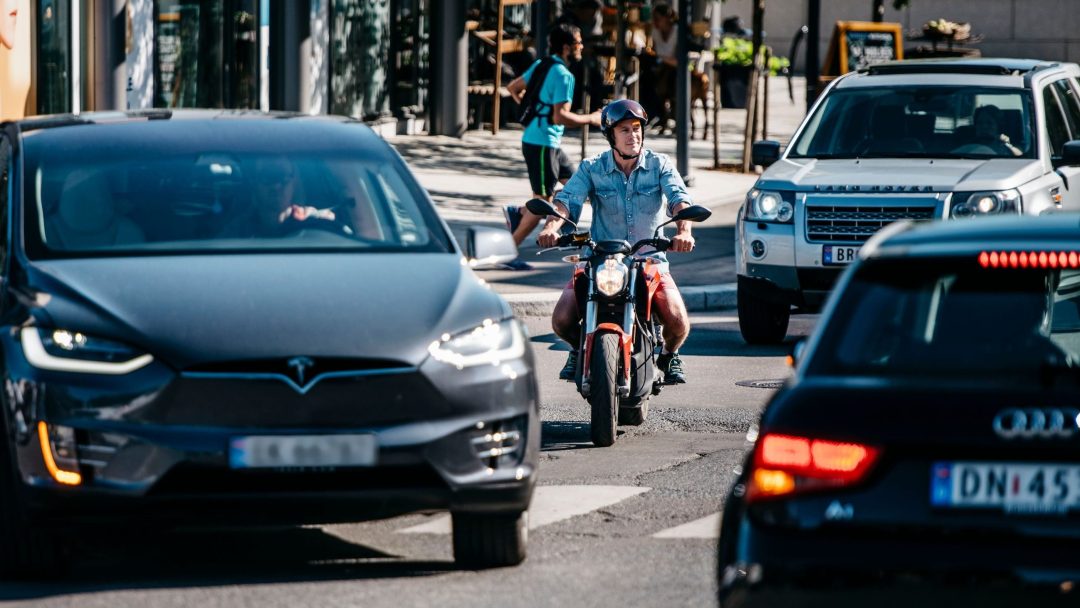
A car can represent both direct and indirect greenhouse gas emissions. The same applies to many of the products we use, but only direct emissions are counted in Oslo. Photo: Fartein Rudjord.
The Climate Budget provides figures for direct GHG emissions, as this is where we can have a direct influence and control. The Climate Budget covers emissions throughout Oslo as a geographic area. This also means that emissions from road traffic in transit are included.
How accurate is the Climate Budget?
Proper, correct statistics on emissions are the main foundations for the Climate Budget. The methods used to create the statistics are constantly developed and improved and, as a result, the methodology used in the climate budget requires regular updates.
Consequently, the content of the Climate Budget has changed over the past four years during which it has been prepared. The Climate Budget is based on the best available knowledge base. However, as this is an analysis of how things will look in the future, the estimates are also uncertain. Annual improvements have lowered this uncertainty each year.
- Please read: The benefits of switching to an electric van
Irrespective of the above, the emissions are created by the actions of all citizens in Oslo, businesses and, not least, the government. The actual cut in emissions requires a change in society.
A comprehensive analysis of the total package of measures shows whether we are achieving the annual goals and emission limits in the Climate Budget. The budget is adjusted annually, together with the financial budget, incorporating new assessments. As such, the budget follows the same period as the economic plan, which is four years. For each annual budget, new analyses are performed to decide whether new measures are required to achieve further cuts in emissions.
When will we know if this all works?
The Norwegian Environment Agency has prepared statistics showing greenhouse gas emissions for each municipality. These comprise emissions from road transport, heating of buildings, sea transport, aviation, construction machinery and other mobile combustion, waste incineration and energy supply, waste and wastewater.
The challenge is that these figures are not available until two years after the emissions have occurred, because it takes time to collect the data and compile the statistics. So, we won’t know for sure whether we have achieved our emission reduction targets for 2020 until 2022.
