Size: x-small
Type: color
Oslo’s Climate Budget 2022
2.4 Development in GHG emissions in Oslo from 2009 to 2019
The Norwegian Environment Agency’s municipal emission inventory is used as a basis in the Climate Budget. The most recent figures in the emission inventory concern 2019. The inventory has been updated back to 2009 as regards the years for which figures are available. The Norwegian Environment Agency has not prepared an emission inventory for 2010, 2012 or 2014. Although the Norwegian Environment Agency’s emission inventory remains subject to considerable uncertainty, it is continually being improved.
The municipal emission inventory only partially reflects the impact of most of the measures in Oslo’s Climate Budget. This emission inventory should therefore not be used in isolation as a basis for the attainment of targets. This is also an important reason why the City of Oslo’s Climate Agency has prepared the «Climate Barometer», which monitors developments in a number of key parameters which provide information on developments in GHG emissions. As the impact of many of the municipality’s climate measures is not reflected in the Norwegian Environment Agency’s emission inventory, it is highly likely that the GHG emissions in Oslo indicated by the Norwegian Environment Agency’s emission inventory are overestimates.
The Norwegian Environment Agency is working to improve the figures before the emission inventory for 2020 is published, which is expected to take place around the turn of the year 2021/2022. Priority areas for improvement include calculating emissions from construction machinery and motorised equipment, as well as methodological improvements concerning emissions from road transport. The scope of these improvements is not known. The City of Oslo’s Climate Agency will continue its dialogue with the directorate in 2022 (see section 5.2 of the Appendix to the 2022 Climate Budget for more information). Adjustments resulting from a change of method will affect emissions throughout the time series, from 2009 through to the most recent emission year.
2.4.1 Emission inventory for Oslo broken down by emission sector
The emission inventory shows that GHG emissions in Oslo totalled around 1.27 million tonnes CO2e in 2019. This represents a decrease of 6.7 % from 2018. The rise in emissions in 2017-18 was caused by an increase in emissions from diesel-powered motorised equipment and a reduction in the use of biofuels in road transport. During the period 2009 to 2019, GHG emissions reached a minimum in 2019, and emissions have declined by 16 % compared with the 2009 level (Figure 1). Emissions have been declining in almost all sectors since 2009.
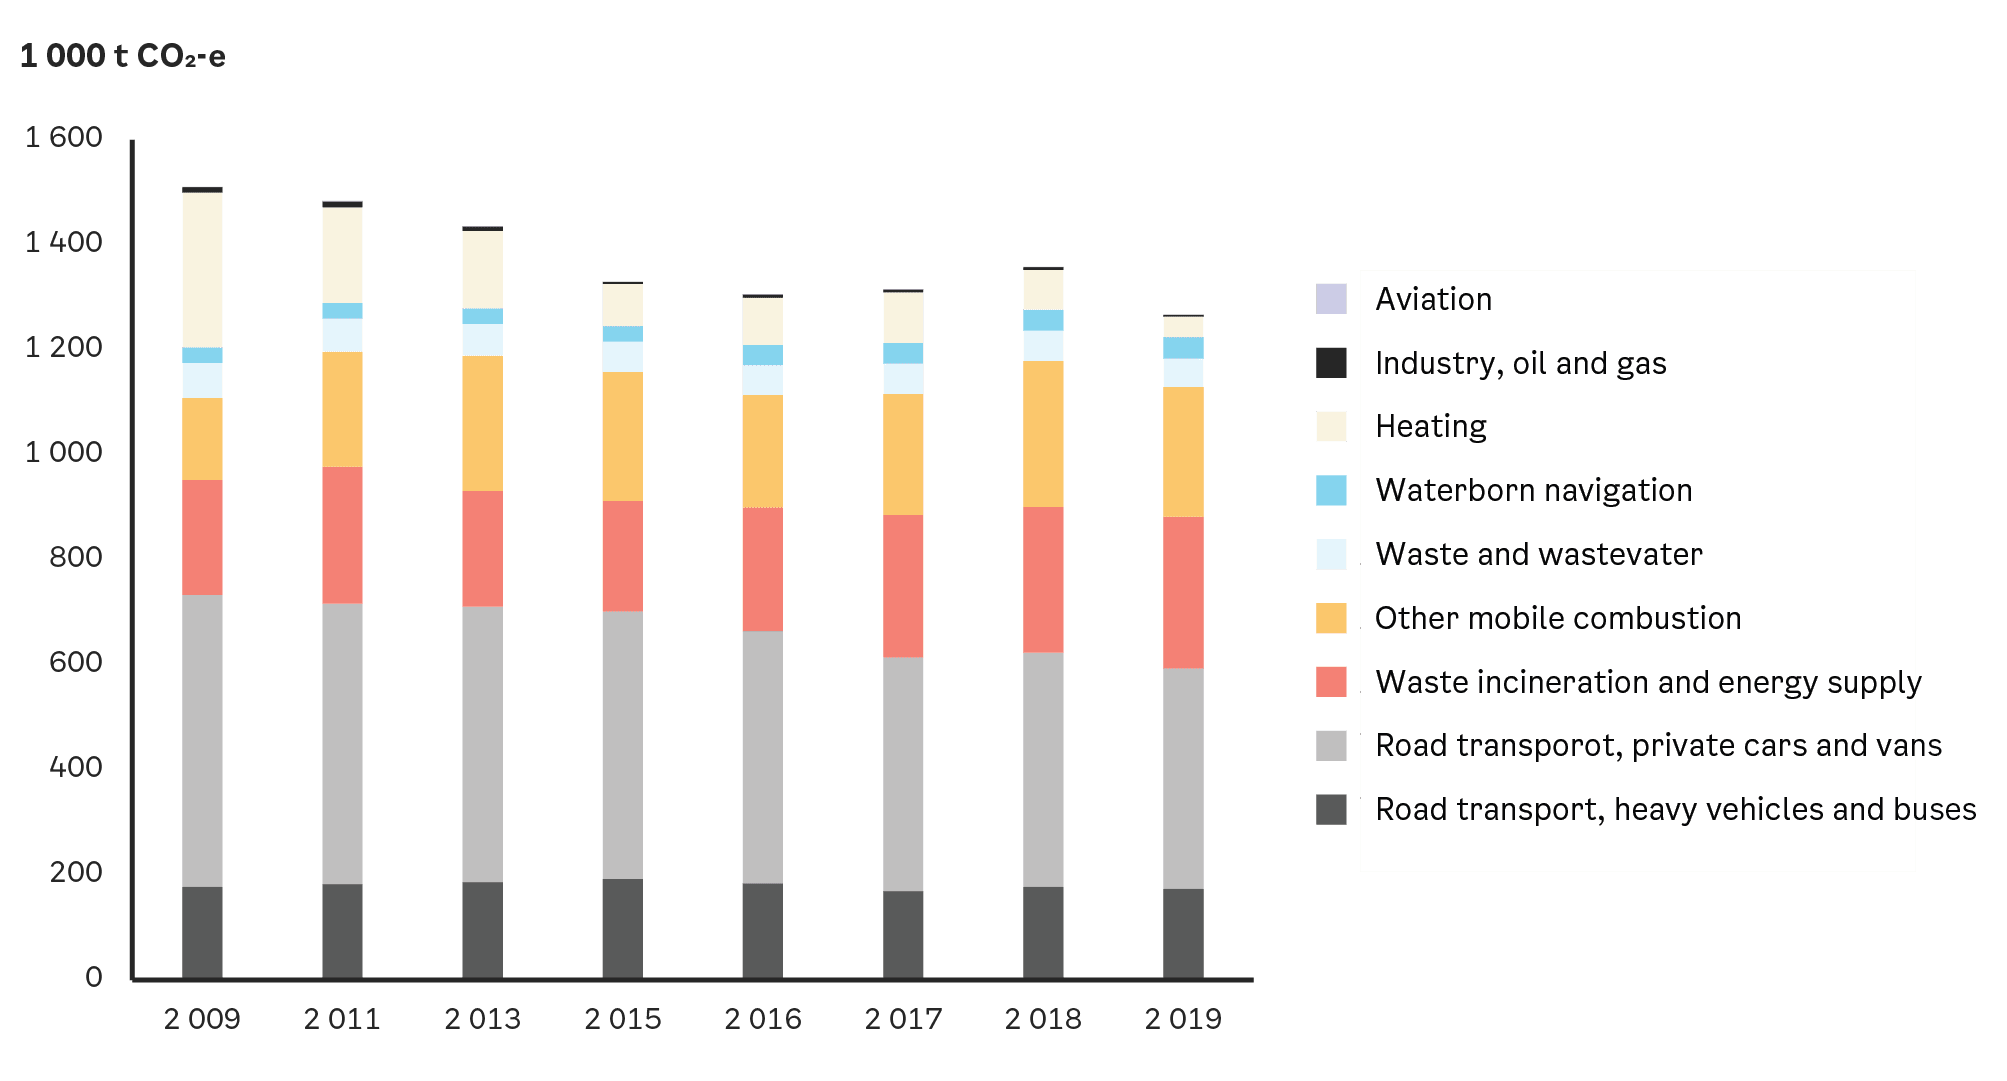
Figure 1: Greenhouse gas emissions in Oslo by emission sector, 2009-2019
All sectors, except for waste incineration, energy supply and shipping, saw reductions in emissions from 2018 to 2019. Emissions from road transport fell by 4.8 % from 2018 to 2019, equivalent to 30,000 tonnes CO2e, as a result of an increase in the proportion of electric cars and the blending of biofuel in petrol and diesel.
Emissions from construction machinery (other mobile combustion) fell by 11 % and just under 31,000 tonnes CO2e. However, the underlying data and the method used to calculate these emissions are uncertain. Emissions from heating declined by 48 %, equivalent to just over 36,000 tonnes CO2e, as a result of a sharp decrease in the use of fossil heating sources. The decrease is the result of adaptation to the ban on oil-fired heating, which entered into force on 1 January 2020.
As Figure 2 shows, the largest sources of emissions are road transport (47 %), waste incineration and energy supply (23 %, mainly the incineration of fossil waste) and other mobile combustion, i.e. construction machinery and motorised equipment (20 %). The Norwegian Environment Agency’s publication of the emission inventory for 2019 again included emissions from landfill sites, which are now included under emissions from the waste and wastewater sector.
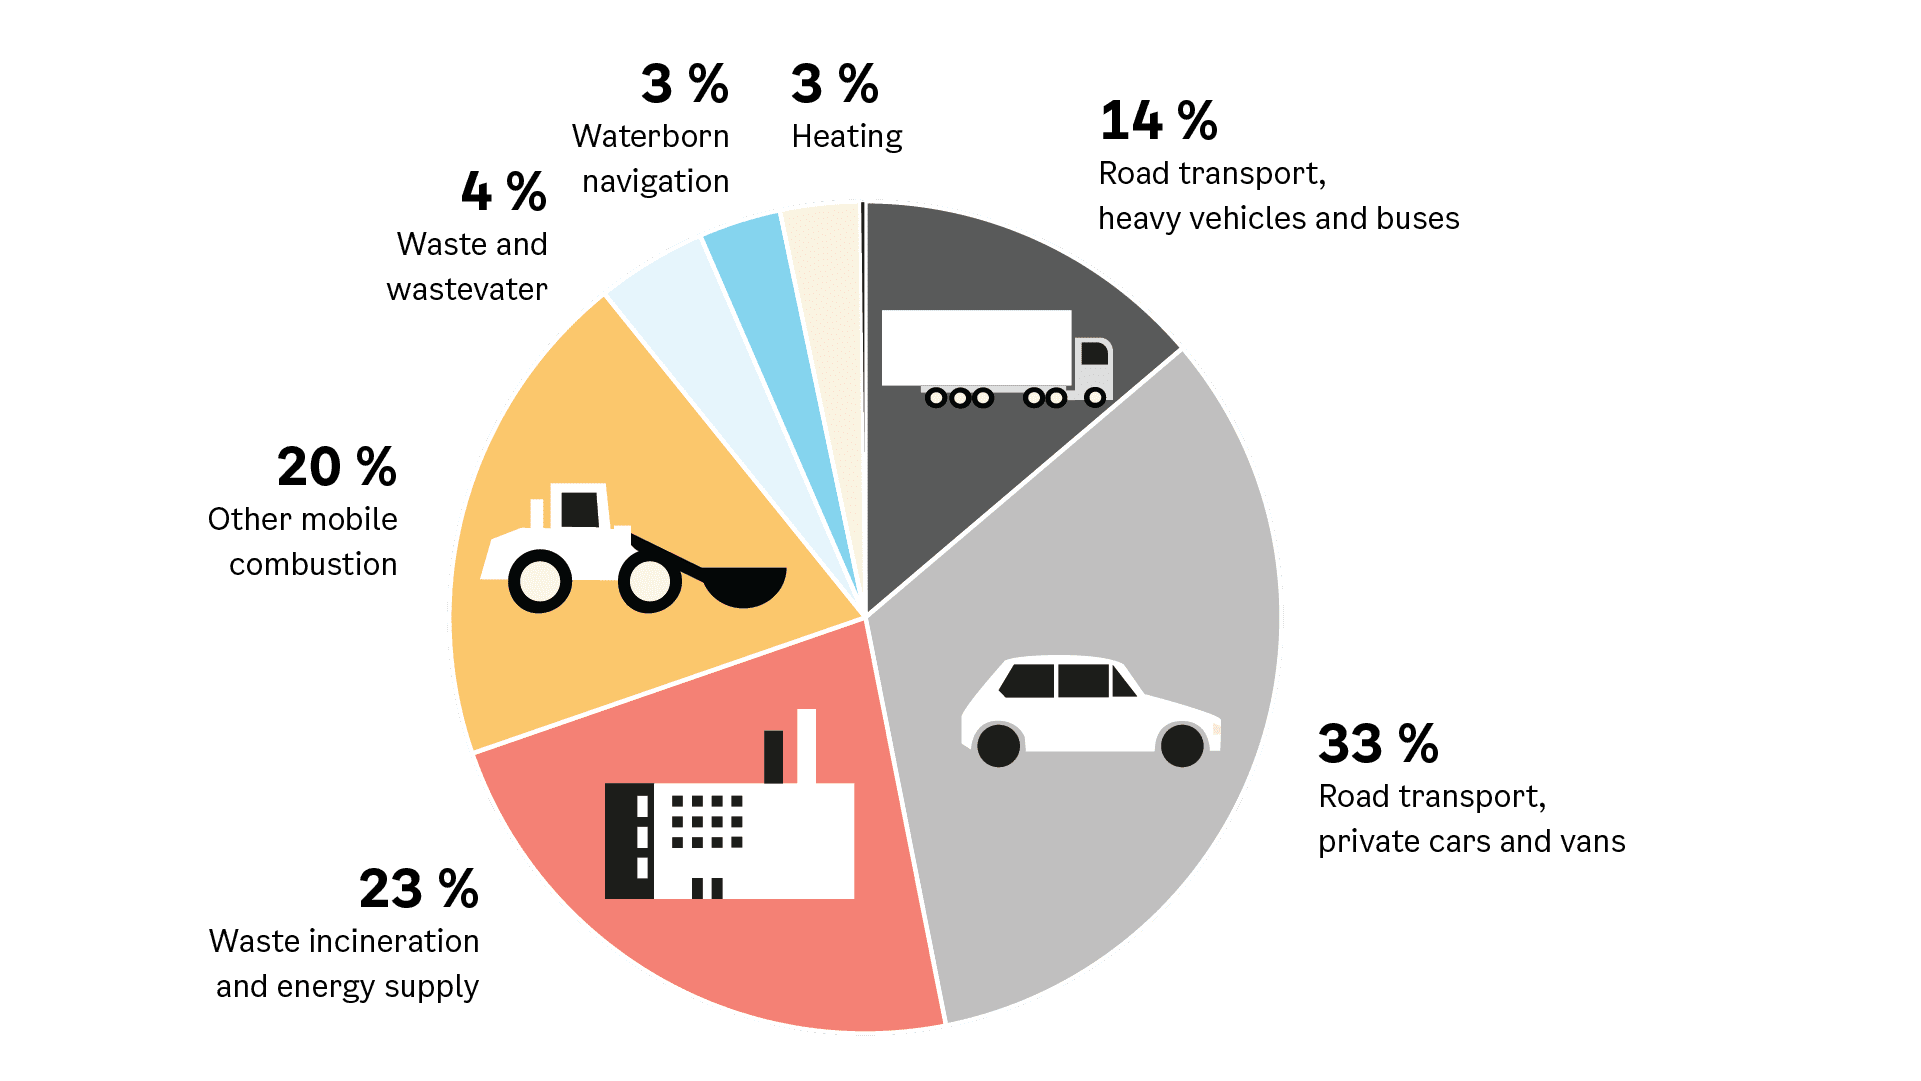
Figure 2: GHG emissions in Oslo by emission sector, 2019